
Numbers we can show you, and where each one comes from.
Performance marketing, SEO and content results from education brands, each with its source, period and baseline. If we can't show the source, we don't show the number.
1
Creative review
A 15-minute call. One specific observation about your brand.
2
Written scope
What’s included and what’s charged separately.
3
Build and launch
Led by a named creative lead from our founding team.
4
Report and improve
Reviewed on the cadence agreed at the start. Exports you can check.
Performance marketing
Meta, Google, LinkedIn and YouTube, judged on qualified conversations rather than impressions.
38.8%
Paid social engagement rate
Source: GA4 · Aug–Nov 2026 · baseline 27.7%
17s
Time per paid social session
Source: GA4 · Aug–Nov 2026 · baseline 10s
6.53
Events per paid social session
Source: GA4 · Aug–Nov 2026 · baseline 4.00
63.2%
Facebook ads engagement rate
Source: GA4 · Aug–Nov 2026 · baseline 31.9%
Paid social contacts by month (GA4)
| Period | Sessions | Contacts | Rate |
|---|---|---|---|
|
14 Aug–12 Sep |
7,221 |
432 |
2.53% |
|
13 Sep–12 Oct |
1,303 |
13 |
1.00% |
|
13 Oct–11 Nov |
3,838 |
9 |
0.18% |
By platform
| Platform | Start | Now | Metric |
|---|---|---|---|
|
Meta ads |
29.3% |
40.2% |
Engagement rate |
|
LinkedIn ads |
10.8% |
21.3% |
Engagement rate |
Ad creatives we ran, and the action each was built to drive
Tilli · Workshop registrations

Mathspace · Free-trial demos

SaySomethingin · Free downloads
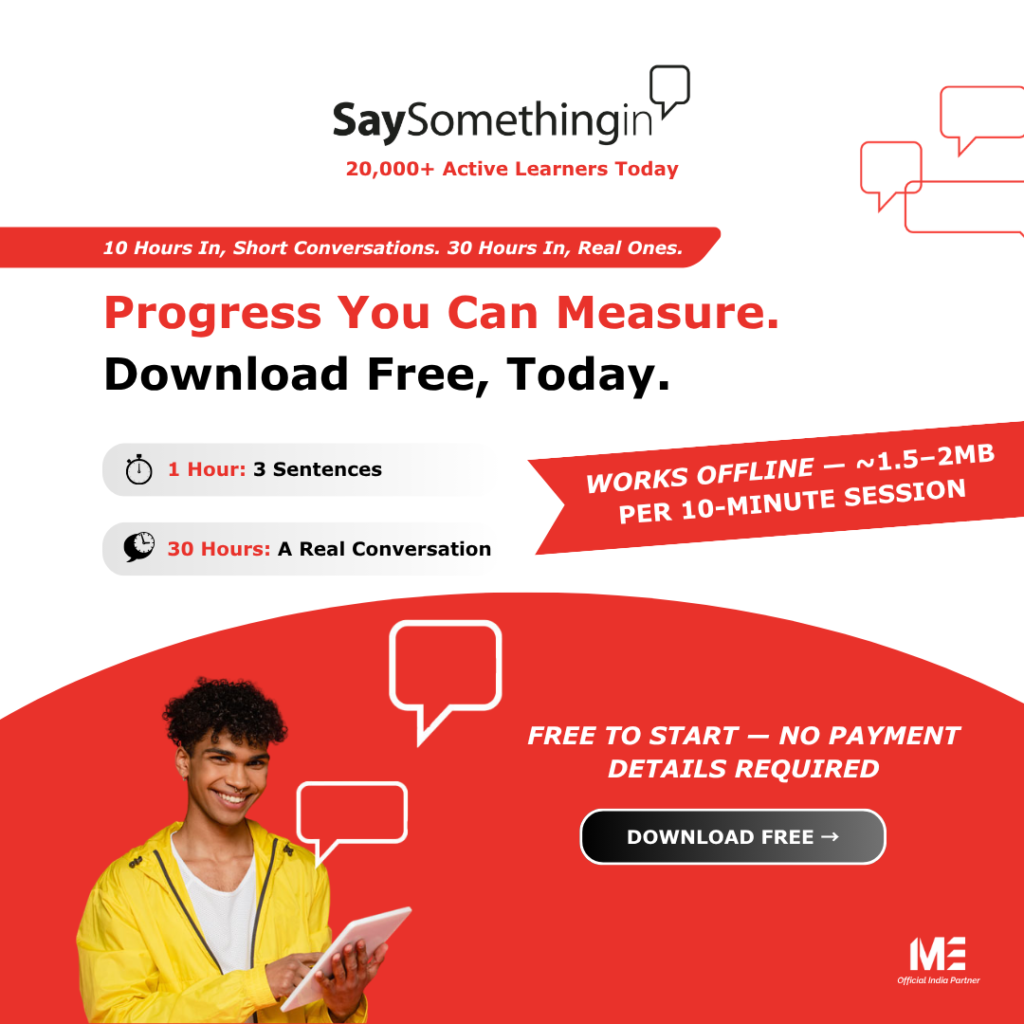
West River Academy · Enquiries

SEO and AI visibility
Rankings, organic traffic and citations in AI answers, each against its starting point.
21
Organic contact clicks
Source: GA4 · Aug–Nov 2026 · baseline 14
0.59%
Organic contact rate
Source: GA4 · Aug–Nov 2026 · baseline 0.29%
8.0
Avg. position, “india market entry consultant”
Source: Search Console · Aug–Nov 2026 · baseline 16.3
46%
Engagement rate, AI assistant visits
Source: GA4 · Aug–Nov 2026 · baseline 40.4%
Rankings: start against now
| Keyword | Start | Now | URL |
|---|---|---|---|
|
india market entry consultant |
16.3 |
8.0 |
/about-us/ |
|
edtech in india |
12.1 |
9.1 |
/india-edtech-market-opportunities-for-uk-us-companies |
Organic sessions by month (GA4)
| Period | Sessions | Engaged | Contacts |
|---|---|---|---|
|
14 Aug–12 Sep |
756 |
45.9% |
8 |
|
13 Sep–12 Oct |
920 |
46.1% |
4 |
|
13 Oct–11 Nov |
862 |
52.1% |
9 |
Content marketing
Bylined expertise that earns traffic, subscribers and citations.
3,176
Guide search impressions
Source: Search Console · Aug–Nov 2026 · baseline 1,882
45
Guide clicks
Source: Search Console · Aug–Nov 2026 · baseline 24
107
Clicks to World Book Encyclopedia 2027 pages
Source: Search Console · Aug–Nov 2026 · pages new this period
20
Articles published
Source: indiamarketentry.com blog · 14 Aug–11 Nov 2026
Search clicks per guide: start against now
| Guide | Start | Now | URL |
|---|---|---|---|
|
International schools in India (clicks) |
24 |
45 |
/international-schools-india |
|
World Book Encyclopedia 2027 (clicks) |
1 |
61 |
/encyclopedia-2027/ |
A dashboard you can check, not a PDF you have to trust.
GA4, Search Console and ad-platform data in one view, with exports behind every figure. Reporting cadence is agreed at the start: live dashboard, weekly export or monthly report.
21.9kSessions, 90 days
101kSearch impressions
500Contact clicks
| Channel | Sessions | Engaged | Contacts |
|---|---|---|---|
|
Paid social |
12,253 |
38.8% |
454 |
|
Direct |
4,547 |
35.7% |
12 |
|
Organic search |
2,543 |
48.1% |
21 |
|
Organic social |
662 |
52.4% |
7 |